Academic Resources
Below are a list of resources that I have found to be invaluable as an academic. I am developing this page for other academics, as much as I am creating it for myself, as an easy reference of links that I may easily forget. I am also including a “last updated” column because I recognize that many websites change or disappear. So, if a link doesn’t work, I would use a search engine to see if someone else might have similarly fulfilled that particular need for academics.
Please feel free to bookmark and share this page.
Website
Description
Screenshot
Last updated
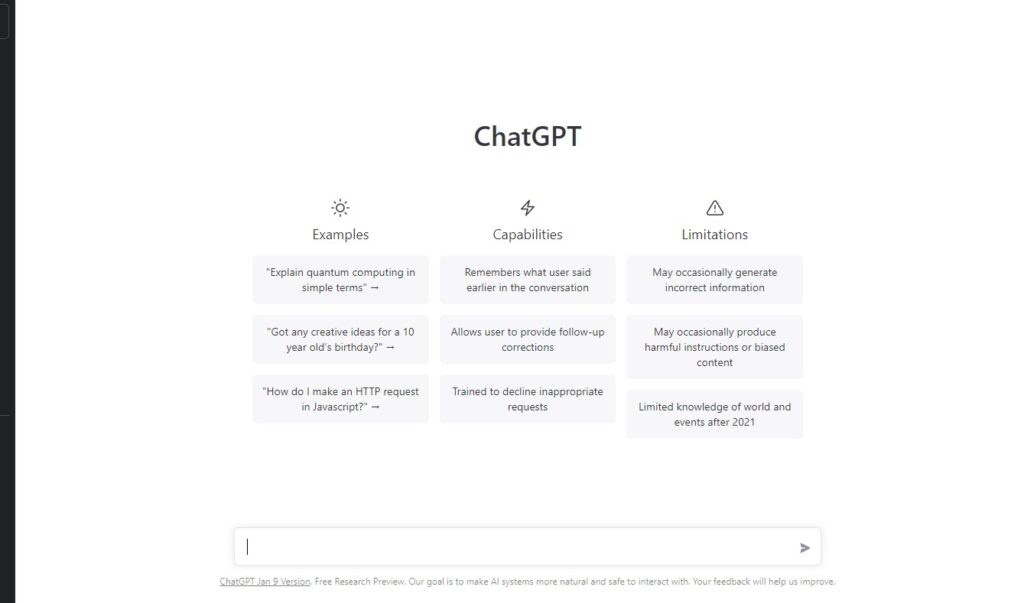
While AI generated text has been around before, the things that I think sets ChatGPT apart is the fact that it is 1) very powerful, and 2) very accessible. With a simple sign-up, without having to install any software or know any programming, you can begin using chatGPT. The AI is very good at processing complex queries. For example, you can literally ask it to help you understand the difference between two sociological theories, and it would probably explain it better and clearer than I could.
Jan. 27, 2023
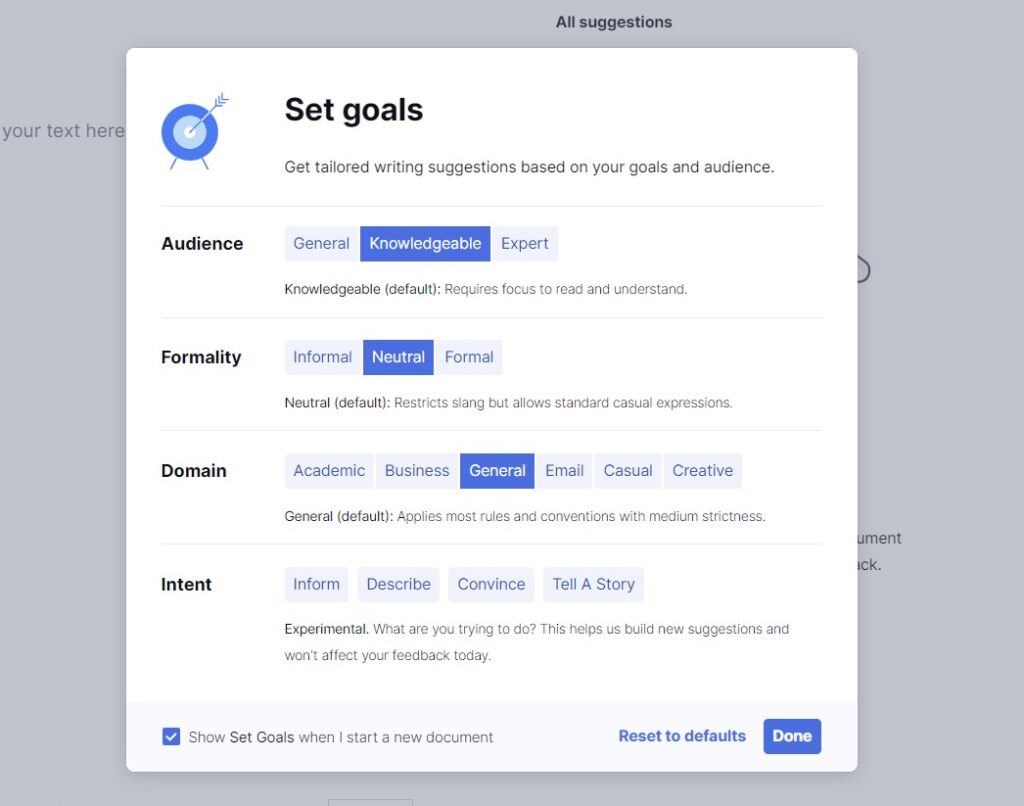
Grammarly is a writing-assistance tool that checks grammar, punctuation, and style in written text, and suggests corrections and improvements. It can be used as a browser extension, desktop app, and mobile app and it can check text written in various platforms such as social media, messaging apps, and email. It helps writers to produce error-free, clear and effective writing, by identifying and correcting errors and providing suggestions for improvement.
Jan. 24, 2023
A powerful tool to see the connections within your [Zotero] bibliography, the citations they have in common, and any newer papers using your citations. It is not a perfect tool, with gaps in their database. But it is a helpful tool that might reveal new literature that you might not have been aware of before.
Nov. 29, 2022
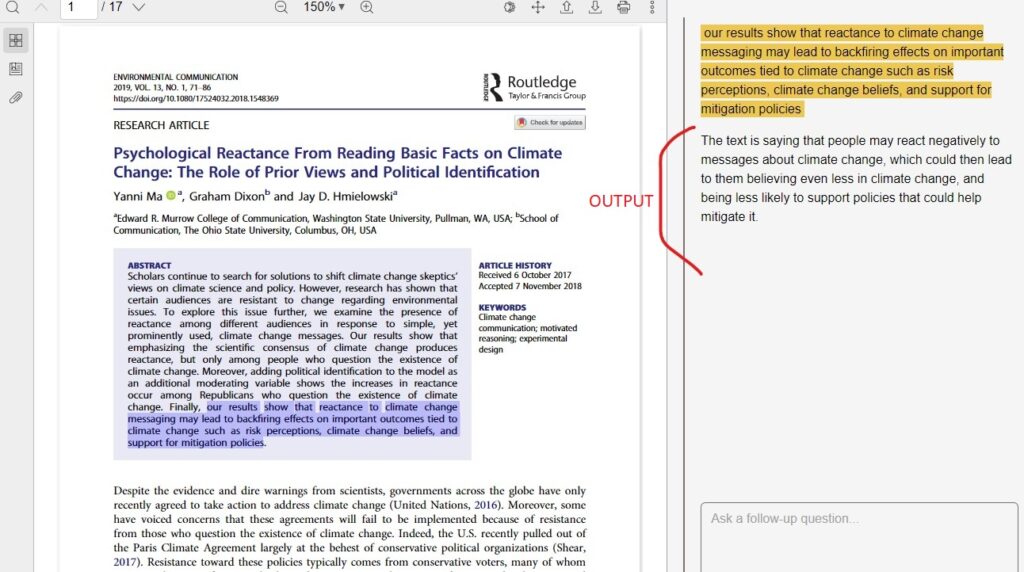
Upload an academic paper (in pdf format) to this website, then highlight any words or phrases that are outside of your expertise. This website uses AI to explain the highlighted words in simpler terms, in language that is easier to understand, by analyzing the rest of the paper for context to better explain the highlighted terms.
Nov. 29, 2022
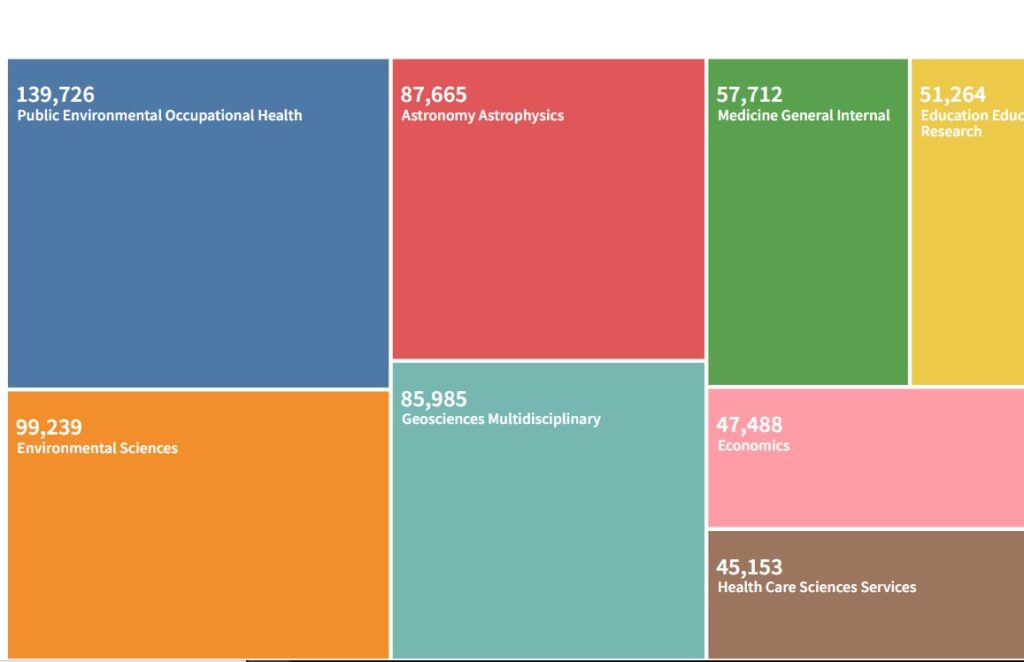
This website requires a subscription (typically provided through your university), but if you have access, I have found this website to be the most powerful research tool. It allows you to formulate complex queries, with a wide range of sorting functions and filters. It has the ability to export your saved results into an Excel, and you can even analyze your results by category. A must-use if you are doing academic research.
Dec. 01, 2022
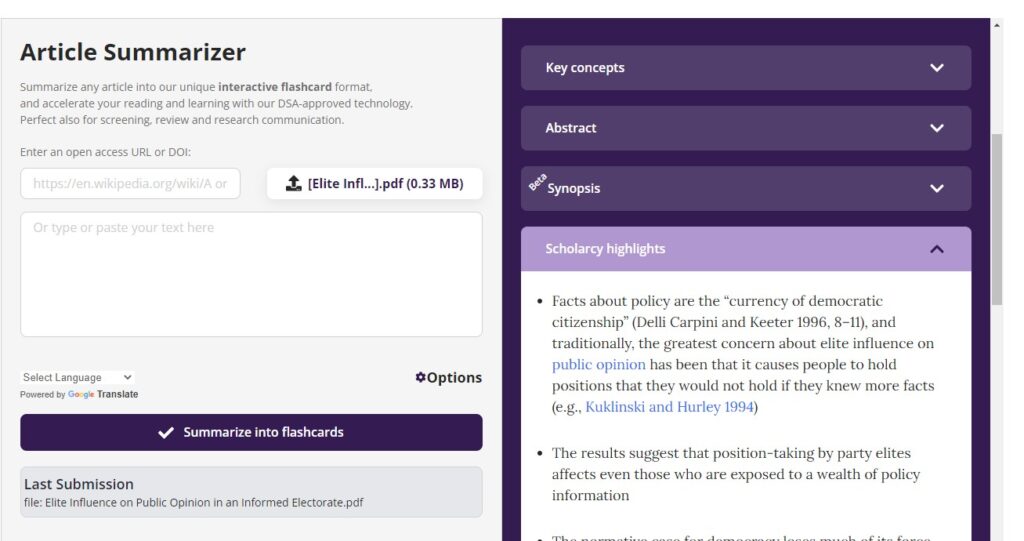
We all have those academic papers saved that we just won’t ever have enough time to read. Well, this website helps you triage through at least some of those files by taking your pdf and using AI to spit out a number of summary outputs.
Nov. 29, 2022
If you need to collaborate on a video for a presentation or a research project, Ssemble is an online collaborative video editor. Think of it like PowerPoint but for videos, making it a valuable tool for academic multimedia tasks. They also offer a free trial version for one project that is less than 5 minutes long.

Sep. 17, 2023
This website provides curated annotated bibliographies for a wide range of topics. For example, if you want to know more about ‘norms’, Dr. Christine Horne (professor at WSU) has put together a short list of foundational readings to the topic. I make sure to visit this website at the early stages of exploring any new topic.

Nov. 29, 2022
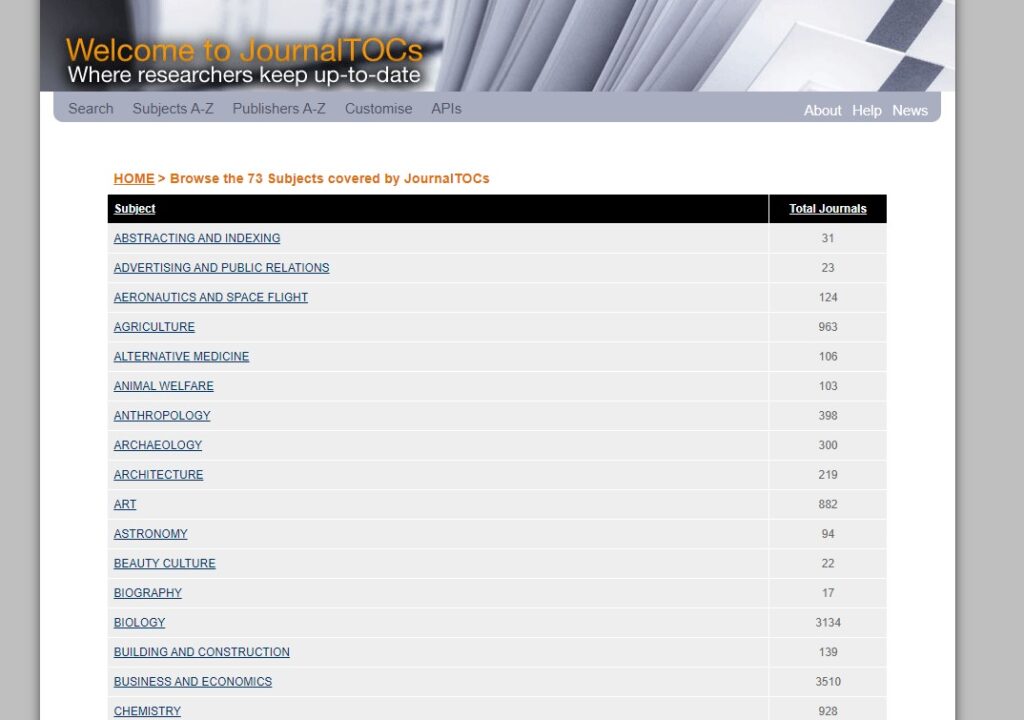
This website allows you to subscribe to a number of academic journals. You can then choose the frequency of which you will be informed of new publications in those journals. I use this website to help me keep up with the latest research in my field.
Nov. 29, 2022
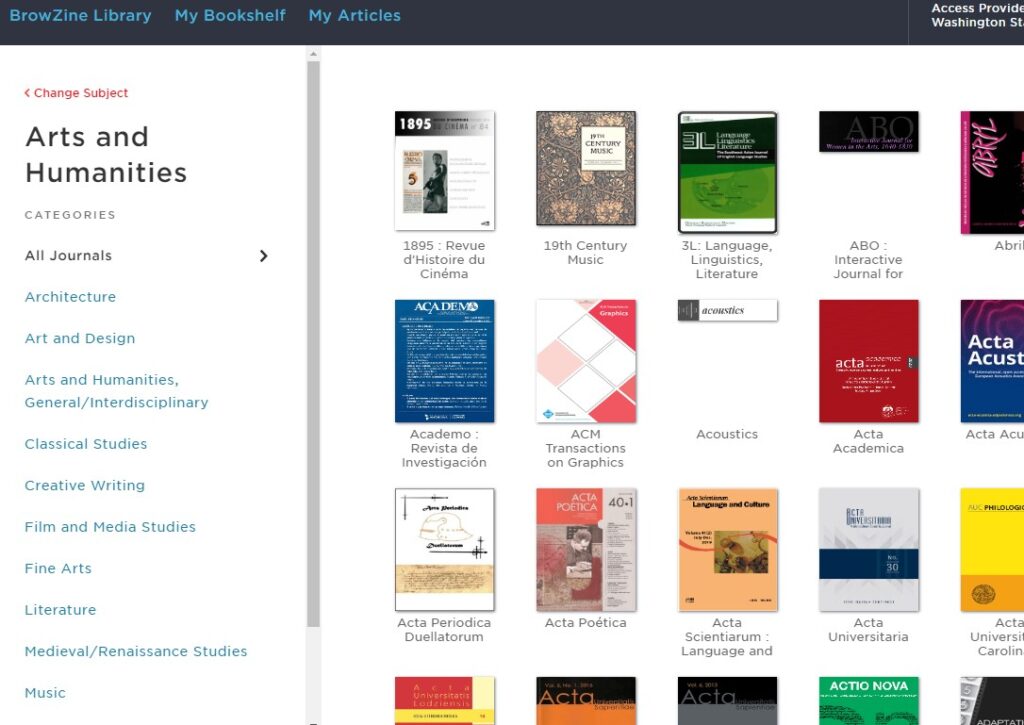
This website allows you to read through the articles in a number of journals, using their website or their dedicated tablet app. You will need a subscription (usually provided by your university).
Dec. 01, 2022
A Sankey diagram allows you to easily graph flows of data, where the height of each flow varies by the size of the data. I have found this form of graphing useful to keep track of how I have merged multiple data sources into a single file.

Nov. 29, 2022
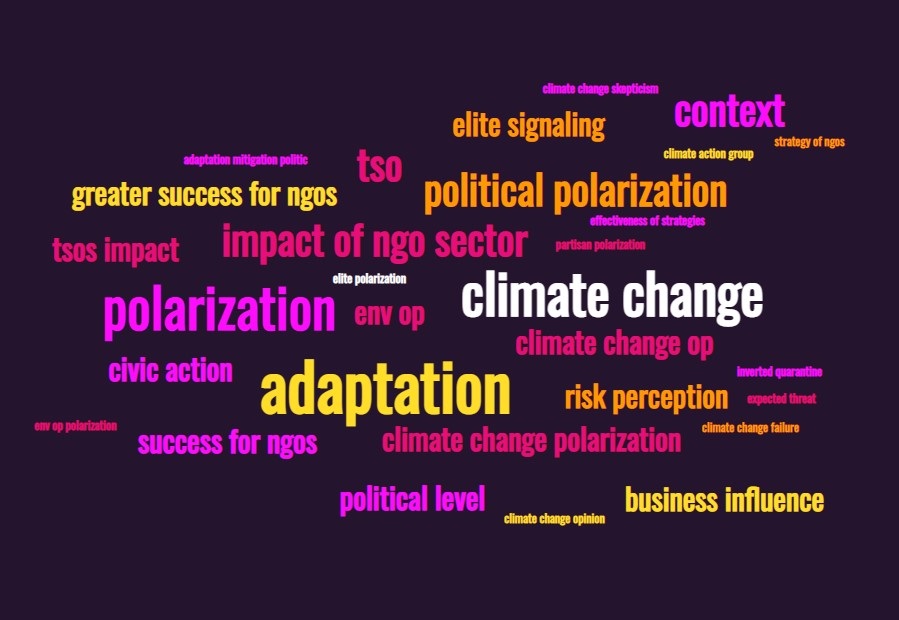
A word cloud shows a visual representation of the most common words in a list of words, with more common words appearing larger. If you are like me, and keep track of your readings in an excel file, you can simply highlight all of the cells in a column (say, if you have a column for ‘key words’), copy and paste into this website, and you will get a graph showing the most common keywords.
Nov. 29, 2022
This website provides a wealth of data, most of which is open access. They call themselves, “The world’s largest social science data archive.”

Nov. 18, 2022
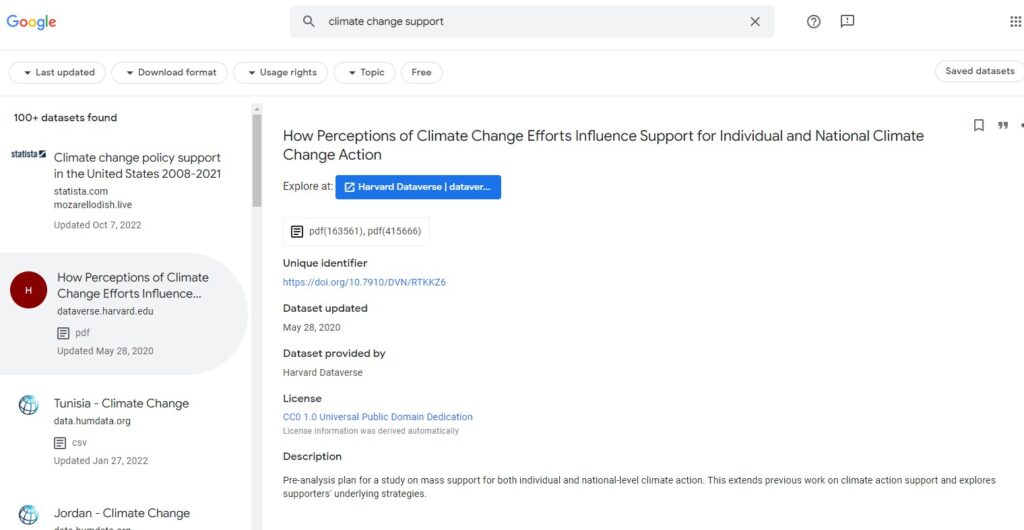
This is a dataset search engine powered by Google. It is not perfect, but it is definitely a good resource to know about.
Nov. 21, 2022
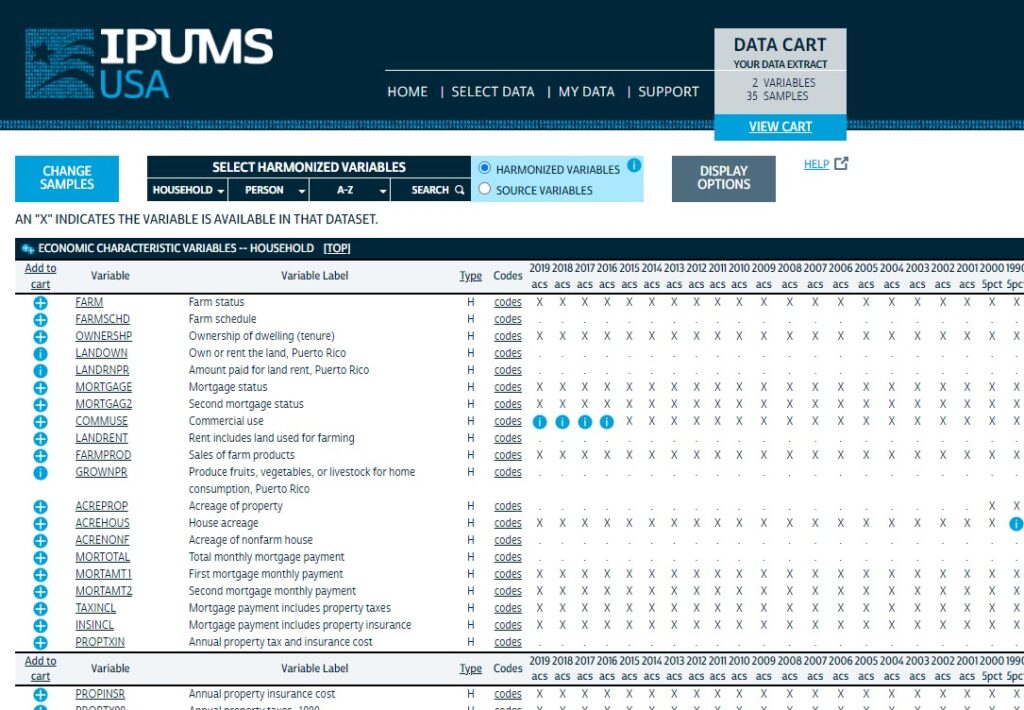
This website combines U.S. census data from various sources, and makes it easy to download the data all in one place.
Nov. 21, 2022
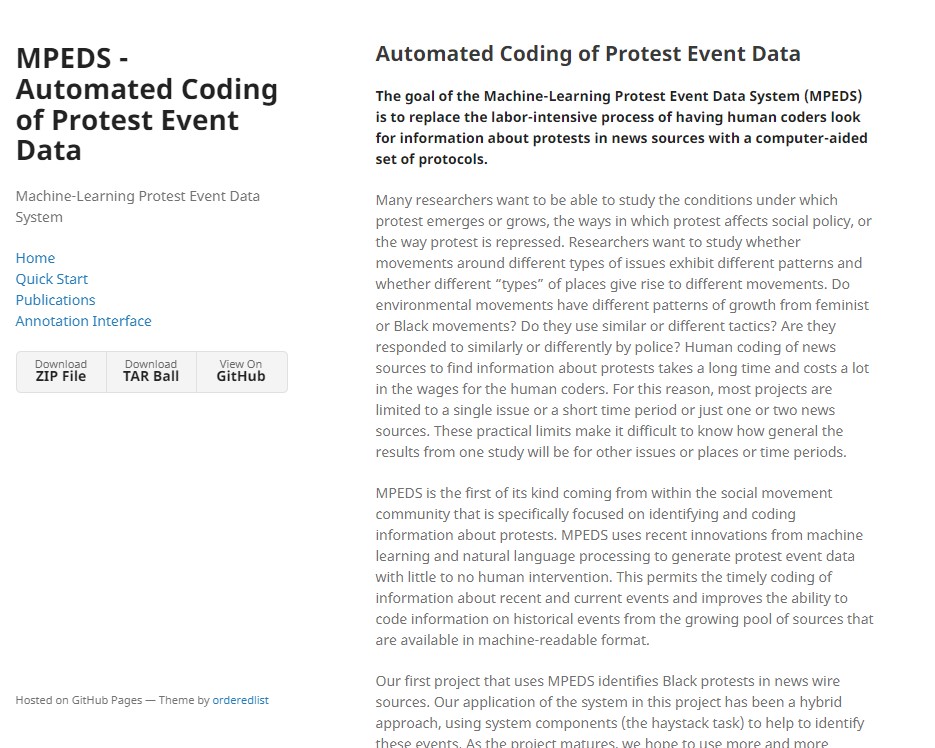
“MPEDS – Automated Coding of Protest Event Data” is meant to provide easy access to protest data for social science research.
Nov. 26, 2022
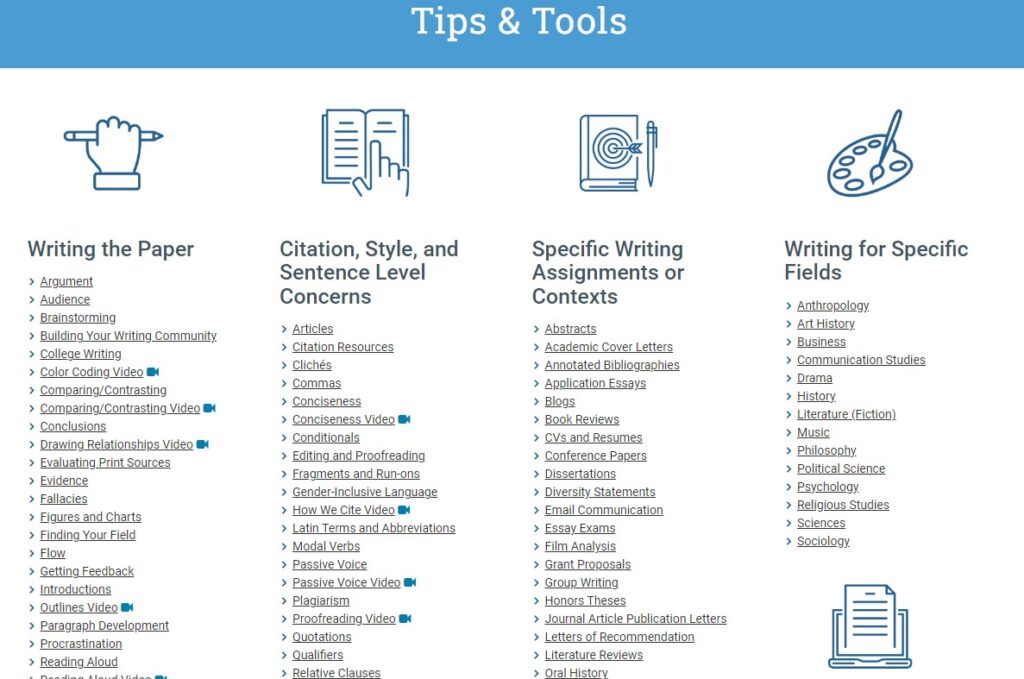
A fantastic resource to help you overcome any academic writing stumbling blocks.
Nov. 26, 2022
This website provides software that allows you to simulate various natural and social phenomena. I first learned about this website when a colleague of mine used it to map the concept of homophily in racially-segregated neighborhoods.
Nov. 26, 2022
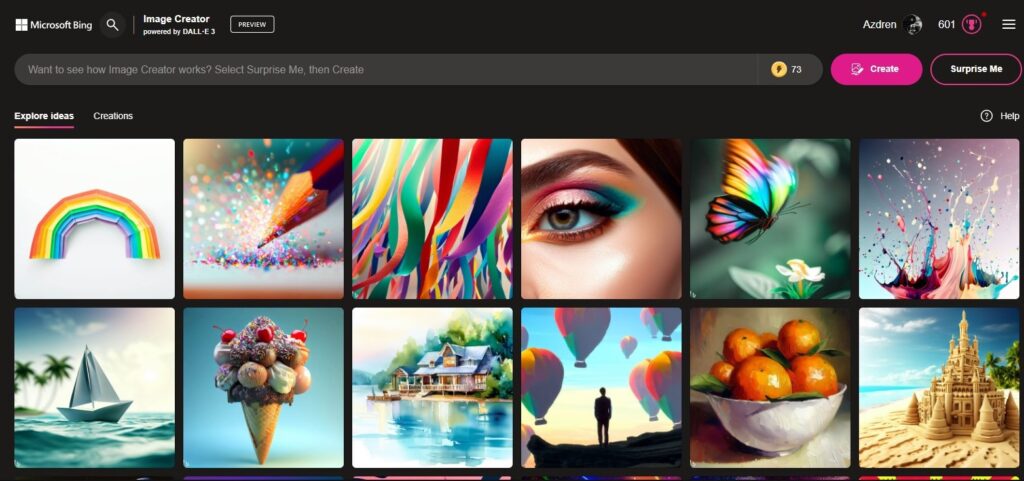
Create AI-generated images through Bing. At the time of this update, Bing uses DALL*E 3 by OpenAI to create images. Creating images may be helpful in spicing up presentations, or creating images for teaching lessons.
Oct. 07, 2023
